|
|
Tiger
Apr 3, 2022 1:59:47 GMT -5
Post by brobear on Apr 3, 2022 1:59:47 GMT -5
Behavior of Brown Bears During Feeding in the Sikhote-Alin - continued: Consumption of man-made feed is an exception rather than a rule for brown bears in Sikhote-Alin. This is due to the fact that the scale of agricultural activities (growing of crops, cattle breeding) is low in the habitats of the species. On the other hand, various high-calorie natural feeds are readily available, except in rare hungry years with low fruitage of all fattening fruit. However, the animals consume man-made food resources. Most often bears visit agricultural crops sites: oats, corn and soybeans. In the western regions of Russia (in the southern taiga subzone) oats is a major fattening feed for bears which feed on its crops damaging the agriculture (Pazhetnova and Pazhetnov, 1987). In the Far East brown bears also feed on oats crops, but to a small extent. In 1994, a radiolabeled male brown bear 3–4 years old was living in the delta of Dzhigitovka River in an area subject to significant human impact. From July 28 to August 7 the bear lived in a 1.5 km2 littered alder forest surrounded by crops of oats and forage grasses (Seryodkin, 2006). During the day, the animal hardly moved, and at nightfall went to the fields to feed. It made a continuous path along the forest at the edge of the field, which branched in the direction of individual trees in the field. There we no other bears at the site at the time, judging by the trail. 500 m long parallel transects set out on in the field at the distances of 10, 35 and 65 m from the forest edge allowed to assess the intensity of the use of the feeding territory by the bear depending on the distance from its main shelter. 55 bear passes were recorded at the transect located at 10 m from the forest, 22 passes – at a distance of 30 m, and only 5 – at a distance of 65 m. The observed bear was actively using a 40–50 m wide strip of field along the forest, rarely going further into the field. This example shows the dependence of the behavior of the animal during feeding on oats on the living conditions of the animal, covered in detail for the bears of the European part of Russia (Pazhetnova and Pazhetnov, 1987, Pazhetnov, 1990). As in other regions (Zhiryakov, 1975, Loskutov et al., 1993, Slobodyan, 1993, Sobansky and Zavatsky, 1993) brown bears in the Sikhote-Alin visit bee-gardens where they steal and break hives in hope to feed on honey. In August–September 1960 (a hungry year for bears) 16 bears were killed in bee-gardens in Yakovlevsky region of Primorsky Krai (Abramov, 1972). Some brown bears attack domestic animals, mostly cattle. Such cases are recorded about once every 2–3 years in various parts of the south of the Russian Far East (Bromlei, 1965). Some individuals may specialize in procurement of cattle (Pazhetnov, 1990). Bears visit dumpsites and steal bait. At the dumpsites of meat plants located in forest zone (Spassky region of Primorsky Krai) the animals do not react to arriving cars, come here at 4 p.m. and feed dragging the waste to the nearest shelter (Yudin, 1993). Bears kidnap bait from the traps of hunters (Bromlei, 1965) and ruin winter huts in search of food. Destroying tree-stands the animals take the products and bags of hunters. There was a case when a bear ate muskrats from traps and at night approached the camp of muskrat trappers in search of food (Abramov, 1972). There were cases when the animals were trying to dig up the graves in the cemetery of Komsomolsk town, and 4 predators were shot at this (Dunishenko, 1991). From time to time, brown bears kill and eat people. The latter often happens to the wounded and sick predators. www.sciencedirect.com/science/article/pii/S207815201630027X |
|
|
|
Tiger
Apr 3, 2022 2:10:52 GMT -5
Post by brobear on Apr 3, 2022 2:10:52 GMT -5
|
|
|
|
Tiger
Apr 3, 2022 2:22:38 GMT -5
Post by brobear on Apr 3, 2022 2:22:38 GMT -5
Quotes:
Reply #18 - Large bears cannot only eat up remains after tigers, but also chase them off their prey or join the fight (Sysoev, 1966, Kucherenko, 1971, Kostoglod, 1976, Seryodkin et al., 2005a). In the snow period some bears purposely track tigers and lynxes to find the remains or take away their prey (Kostoglod, 1976, Seryodkin et al., 2012). According to observations of Kostoglod, the trail of a bear not settled in its lair tracking other predators in order to capture their prey was 22% of the total length of the bear trail (44 km out of 200 km) (Kostoglod, 1976). In the spring before snow melting bears look for animals which died during winter and prey of tigers buried in snow (Seryodkin et al., 2005a).
Reply #19 - Brown bears can be aggressive towards the predators (other bears, tigers) and people approaching their prey or carrion.
|
|
|
|
Tiger
Apr 5, 2022 8:31:12 GMT -5
Post by brobear on Apr 5, 2022 8:31:12 GMT -5
50 Siberian tiger cubs born in China's Heilongjiang park. BEIJING: China's largest Siberian tiger breeding centre Heilongjiang Siberian Tiger Park has announced that over 50 tiger cubs were born there this year. Located in northeast China's Heilongjiang province, the park has over 1,000 Siberian tigers. Scientists handpick certain tigers, using a DNA database, to breed the next generation every year, the park announced yesterday. Park's chief engineer Liu Dan said the park has been controlling the tigers' population to around 1,000 in order to maintain the ecological balance. The peak season for the breeding of Siberian tigers is in May and June. The cubs, after living with their mothers for some 100 days, would be sent to a semi-wild environment of the park so that they can learn to run and hunt, state-run Xinhua news agency reported. Siberian tigers are among the world's most endangered species. They mostly live in northeast China and eastern Russia. The Heilongjiang Siberian Tiger Park was established in 1986 for better protection of the species. Read more at: economictimes.indiatimes.com/news/international/world-news/50-siberian-tiger-cubs-born-in-chinas-heilongjiang-park/articleshow/53592217.cms?utm_source=contentofinterest&utm_medium=text&utm_campaign=cppst |
|
|
|
Tiger
Apr 5, 2022 8:34:43 GMT -5
Post by brobear on Apr 5, 2022 8:34:43 GMT -5
|
|
|
|
Tiger
Apr 5, 2022 9:23:37 GMT -5
Post by brobear on Apr 5, 2022 9:23:37 GMT -5
Prey selection of Amur tigers in relation to the spatiotemporal overlap with prey across the Sino–Russian border bioone.org/journals/wildlife-biology/volume-2019/issue-1/wlb.00508/Prey-selection-of-Amur-tigers-in-relation-to-the-spatiotemporal/10.2981/wlb.00508.full The endangered Amur tiger Panthera tigris altaica is confined primarily to a narrow area along the border with Russia in northeast China. Little is known about the foraging strategies of this small subpopulation in Hunchun Nature Reserve on the Chinese side of the border; at this location, the prey base and land use patterns are distinctly different from those in the larger population of the Sikhote-Alin Mountains of Russia. Using dietary analysis of scats and camera-trapping data from Hunchun Nature Reserve, we assessed spatiotemporal overlap of tigers and their prey and identified prey selection patterns to enhance understanding of the ecological requirements of tigers in northeast China. Results indicated that wild prey constituted 94.9% of the total biomass consumed by tigers; domestic livestock represented 5.1% of the diet. Two species, wild boar Sus scrofa and sika deer Cervus nippon, collectively represented 83% of the biomass consumed by tigers. Despite lower spatial overlap of tigers and wild boar compared to tigers and sika deer, tigers preferentially preyed on boar, likely facilitated by high temporal overlap in activity patterns. Tigers exhibit significant spatial overlap with sika deer, likely favoring a high level of tiger predation on this large-sized ungulate. However, tigers did not preferred roe deer Capreolus pygargus and showed a low spatial overlap with roe deer. Overall, our results suggest that tiger prey selection is determined by prey body size and also overlap in tiger and prey use of time or space. Also, we suggest that strategies designed to minimize livestock forays into forested lands may be important for decreasing the livestock depredation by tigers. This study offers a framework to simultaneously integrate food habit analysis with the distribution of predators and prey through time and space to provide a comprehensive understanding of foraging strategies of large carnivores. The tiger Panthera tigris, a charismatic species and the largest of the extant cats in the world, has lost 93% its historical range during the past century (Dinerstein et al. 2007). Habitat loss, poaching and widespread wild prey depletion have been the principle contributors to the tigers decline over the last several decades. Tigers now persist in increasingly isolated and often degraded habitats, and are on the brink of local extinction in many locations (Gopal et al. 2010, Walston et al. 2010, Wang et al. 2016, 2017). Tigers generally perform better and reach higher densities where the prey density of medium to large wild ungulates is high (Karanth et al. 2004, Miquelle et al. 2010). Prey selection by large felids plays a fundamental role in defining their geographical distribution, dispersal, habitat selection and social structure (Sunquist and Sunquist 1989, Karanth et al. 2004, Petrunenko et al. 2016). Continued decreases in the density of key prey species may currently be one of the major threats to tiger persistence in many areas (Karanth and Stith 1999, Hebblewhite et al. 2012, Wang et al. 2016, 2017, Sandom et al. 2017). Knowledge of both tiger diet and the abundance of its primary prey are critical to recovering small and threatened populations (Biswas and Sankar 2002, Khorozyan et al. 2015). It is the case with the endangered Amur (Siberian) tiger P. t. altaica, which occurs on the most northern edge of the tiger's range. Currently, fewer than 600 individuals are estimated to remain in two isolated subpopulations confined to the Sikhote-Alin Mountains of Russia and the Changbai Mountains along the China–Russia border (Miquelle et al. 2010). Since the late 1990s, the Changbai Mountains trans-boundary subpopulation has gradually increased to approximately 40 individuals and is extending its distribution into China (Wang et al. 2014, 2015, Feng et al. 2017). However, growth of this trans-boundary subpopulation may be limited by conflict with humans in the form of cattle depredations (Soh et al. 2014). Perhaps more importantly, Wang et al. (2016, 2017) reported that cattle grazing degrades tiger habitat by negatively influencing the abundance and distribution of major ungulate prey. In particular, cattle Bos taurus have displaced the sika deer Cervus nippon and have become a major constraint to reestablishment of Amur tigers in northeast China (Wang et al. 2018) because the distribution and territory of tigers are closely associated with those of their principal prey (Karanth et al. 2004, Miquelle et al. 2010). Female Amur tigers require 4–20 times more land (ca 400 km2 home range) than that of any other Asian tiger populations (Miquelle et al. 2010, Hernandez-Blanco et al. 2015). To conserve a minimum viable tiger population in this region requires securing a much larger prey and land base (Wang et al. 2016, 2017, 2018). An analysis of tiger diet is critical to the recovery of this population. Most information on prey selection of Amur tiger comes from studies carried out in southwest Primorye and the Sik-hote-Alin Mountains of the Russian Far East. In those areas, despite tigers having a relatively broad dietary range, consuming approximately 15 different prey species, their diet is uniformly dominated by red deer Cervus elaphus, wild boar Sus scrofa, sika deer and roe deer Capreolus pygargus, which collectively constitute 83–90% of biomass consumed, with other wild prey and domestic species contributing little to tiger diet (Miquelle et al. 1996, 2010, Kerley et al. 2015, Sugimoto et al. 2016). The abundance and vulnerability of preferred food resources (red deer and wild boar) in the landscape are proposed to be the key driving force in determining the habitat use and home range of the Russian Sikhote-Alin tiger population (Petrunenko et al. 2016). Classical diet analysis approaches, such as kill composition and scat analysis, can provide a valid assessment of carnivore predation (Karanth and Sunquist 1995, Kerley et al. 2015). However, these methods have inherent limitations in their ability to simultaneously address the spatiotemporal contact of predator and prey, which may lead to an incomplete understanding of the foraging strategies of solitary predators. Camera traps can document activity patterns and space use from multiple locations within a short time. Camera traps have recently been widely used to augment food habit studies of many carnivores, including jaguar (Weckel et al. 2006), dhole (Kamler et al. 2012) and leopard (Henschel et al. 2011, Braczkowski et al. 2012). However, where or when Amur tigers and their prey co-occur and how tiger–prey interactions influence tiger predation are poorly understood and therefore a research priority for management and conservation of Amur tigers. Here, we investigate, for the first time, the foraging strategies of Amur tigers in Sino-Russian international border zones using scat analysis combined with camera trapping data. Our objectives are to determine: 1) which species constitute the dominant winter prey of tigers, 2) which prey species are selectively preyed upon by tigers and 3) what are the similarities and differences between tiger and prey activity and temporal use patterns. We then compare the diet in Hunchun Reserve with other diet studies of Amur tigers. |
|
|
|
Tiger
Apr 5, 2022 9:26:21 GMT -5
Post by brobear on Apr 5, 2022 9:26:21 GMT -5
From Reply #25 - Spotlight on: Most information on prey selection of Amur tiger comes from studies carried out in southwest Primorye and the Sik-hote-Alin Mountains of the Russian Far East. In those areas, despite tigers having a relatively broad dietary range, consuming approximately 15 different prey species, their diet is uniformly dominated by red deer Cervus elaphus, wild boar Sus scrofa, sika deer and roe deer Capreolus pygargus, which collectively constitute 83–90% of biomass consumed, with other wild prey and domestic species contributing little to tiger diet (Miquelle et al. 1996, 2010, Kerley et al. 2015, Sugimoto et al. 2016). The abundance and vulnerability of preferred food resources (red deer and wild boar) in the landscape are proposed to be the key driving force in determining the habitat use and home range of the Russian Sikhote-Alin tiger population (Petrunenko et al. 2016).
|
|
|
|
Tiger
Apr 5, 2022 9:27:37 GMT -5
Post by brobear on Apr 5, 2022 9:27:37 GMT -5
Study area bioone.org/journals/wildlife-biology/volume-2019/issue-1/wlb.00508/Prey-selection-of-Amur-tigers-in-relation-to-the-spatiotemporal/10.2981/wlb.00508.full The Hunchun Nature Reserve (HNR) established in 2001 is situated in eastern Jilin Province, China, with a total area 1087 km2 (Fig. 1). The reserve borders the Land of Leopard National Park in southwest Primorsky Krai, Russia, forming a trans-boundary conservation landscape (Wang et al. 2016, 2017). The terrain of HNR is hilly to mountainous, with elevation ranging from 5 to 937 m above sea level. The climate is temperate continental monsoon with mean annual temperature ranging from 3.90 to 5.65°C, a frost-free period of 120–126 days per year and mean annual precipitation of 618 mm during 1990–2010. Vegetation is a mixed Korean pine Pinus koraiensis – deciduous forest dominated by Korean pine, Mongolian oak Quercus mongolica, Manchurian walnut Juglans mandshurica, Manchurian ash Fraxinus mandshurica and maple Acer spp. and birch Betula spp. More than 80% of forests have been logged, and nearly 95% of low-elevation forests have been converted into secondary deciduous forests over the past 5 decades (Li et al. 2009, Xiao et al. 2014). Since 1998, logging of natural forests has been halted. More than 14 000 people live in 29 villages within the reserve, and the average people density is 12 people km–2 (Xiao et al. 2016). The main economic activity within HNR is free-range cattle grazing; other human activities include the collection of edible ferns, ginseng farms and frog farming (Wang et al. 2016, 2017). In addition to the Amur tiger, the study area included Amur leopard Panthera pardus orientalis, Eurasian lynx Lynx lynx, black bear Ursus thibetanus and brown bear Ursus arc-tos and potential prey species, such as the sika deer, Siberian roe deer, wild boar and musk deer Moschus moschiferus (Miquelle et al. 2010, Tian et al. 2011, Xiao et al. 2014). Cattle and dogs Canis lupus familiaris were also a common component of the tiger diet. |
|
|
|
Tiger
Apr 5, 2022 9:28:55 GMT -5
Post by brobear on Apr 5, 2022 9:28:55 GMT -5
Reply #27 - Notice bears are mentioned; but not as tiger prey choices.  |
|
|
|
Tiger
Apr 5, 2022 9:30:28 GMT -5
Post by brobear on Apr 5, 2022 9:30:28 GMT -5
Scat analysis bioone.org/journals/wildlife-biology/volume-2019/issue-1/wlb.00508/Prey-selection-of-Amur-tigers-in-relation-to-the-spatiotemporal/10.2981/wlb.00508.full Tiger diet was evaluated using scats (i.e. faeces) that were opportunistically collected by walking a network of small trails, ridgelines, stream beds used by ungulates and tigers as well as forest roads. These routes were patrolled systematically by trained field staff and researchers in HNR in search of scats from November 2014 to April 2015 (Fig. 1) (Dou et al. 2016). We identified tiger scats based on mitochondrial DNA analysis (Dou et al. 2016). After species identification, the tiger scat was thoroughly washed several times over a 0.7 mm screen until prey remains, such as hair and other undigested body parts, were separated from the scat. From each scat, a predefined minimum of 20 hairs were sampled and hairs were identified to species by examining the general appearance (e.g. colour, width, length and tor-tuosity), structure patterns of the cuticle and medulla, and cross sections under a microscope and comparing these to a reference collection of hairs from a standard prey hair manual for Amur tigers (Rozhnov et al. 2011). We used percent occurrence (i.e. percentage of scats containing a particular food item) and percent biomass consumed to quantify the contribution of each species to the tiger diet. For scats containing two prey items, each scat was counted as 0.5 prior to calculating the percent occurrence and percent biomass (Karanth and Sunquist 1995). We used a nonlinear (asymptotic) model (biomass consumed per collectable scat or predator weight = 0.033 – 0.025exp–4.284(prey weight/predator weight)) developed by Chakrabarti et al. (2016) to calculate prey biomass consumed from scats. The mean live weights of tiger and different prey species were obtained from previous studies (Bromley and Kucherenko 1983, Danilkin 1999, Miller et al. 2014) (the prey species that weighed <2 kg were excluded). Finally, we calculated the percent biomass contribution using the above equation (biomass of each prey type consumed/total biomass consumed × 100) (Ramesh et al. 2009). We estimated 95% bootstrapped confidence intervals of percent occurrence and percent biomass contributions based on 10 000 replicates with replacement using percentile method in R package boot. |
|
|
|
Tiger
Apr 5, 2022 9:32:18 GMT -5
Post by brobear on Apr 5, 2022 9:32:18 GMT -5
Camera trap data collection bioone.org/journals/wildlife-biology/volume-2019/issue-1/wlb.00508/Prey-selection-of-Amur-tigers-in-relation-to-the-spatiotemporal/10.2981/wlb.00508.full We employed camera trap field data to assess the abundance, activity patterns and distribution of Amur tigers and potential prey species within the study area. This study, conducted from November 2014 to April 2015, was part of a long-term Tiger Leopard Observation Network (TLON) project that employed camera trap stations in Hunchun Nature Reserve and its surrounding area (Wang et al. 2016, 2017). A total of 104 camera trap stations were used in this study (Fig. 1). We used 3.6 × 3.6 km2 grids to guide camera trap placement throughout the study area. Within the sampling grids, we maximized the detection probability by placing cameras at sites where tigers, leopards and their prey are likely to travel (e.g. along ridges, valley bottoms, trails, forest roads and near scent-marked trees). We deployed cameras along forest roads (n = 48 sites) and game trails (n = 56 sites). We excluded farmland and villages. The cameras (LTL 6210M, Shenzhen, China) were fastened to trees approximately 40–80 cm above the ground and were programmed to take photographs 24 h/day with a 1-minute interval between consecutive events. We report the number of detections and number of trap stations detected for each species. To avoid inflated counts caused by repeated detections of the same event, only one record of a species at a trap site was recorded per 0.5 h. |
|
|
|
Tiger
Apr 5, 2022 9:33:00 GMT -5
Post by brobear on Apr 5, 2022 9:33:00 GMT -5
Abundance of prey species bioone.org/journals/wildlife-biology/volume-2019/issue-1/wlb.00508/Prey-selection-of-Amur-tigers-in-relation-to-the-spatiotemporal/10.2981/wlb.00508.full Because the number of detections of each species is dependent on a unique set of ecological factors we did not use a relative abundance index to estimate prey selectivity (Sollmann et al. 2013). Instead the abundance of three major prey species (i.e. wild boar, roe deer and sika deer) at each camera station was estimated using N-mixture models (Royle 2004) with camera days (total days each camera was in operation) as predictors of detection. We also allowed for time varying detection probabilities within different occasions. N-mixture models assume that all within-site variation in counts is attributable to detection probability and no false-positives occur (i.e. detecting individuals more than once) (Kery and Royle 2015). This approach is suitable when it is impossible to distinguish individuals of the species and is a reasonable surrogate for abundance (Kery and Royle 2015). Recent studies confirm that N-mixture models can provide reliable estimates of relative abundance despite the challenge of ensuring complete population closure within a sampling occasion (Denes et al. 2015, Barker et al. 2017). For each camera site, we used a two-week periods as the temporal sampling unit (i.e. survey occasion) and counted the number of individuals in each ‘event’, an independent 15-second video (we considered ‘events’ occurring >30 min apart as independent) and then calculated the accumulated individuals within each two-week occasion. All models used Poisson distribution and were conducted in the R package unmarked (Fiske and Chandler 2011). |
|
|
|
Tiger
Apr 5, 2022 9:34:07 GMT -5
Post by brobear on Apr 5, 2022 9:34:07 GMT -5
Prey selectivity bioone.org/journals/wildlife-biology/volume-2019/issue-1/wlb.00508/Prey-selection-of-Amur-tigers-in-relation-to-the-spatiotemporal/10.2981/wlb.00508.full Prey selection, or feeding preferences, of tigers was estimated for each species by comparing the observed proportion of prey items in scats (i.e. utilization) with the expected proportion of potential prey in the environment (i.e. availability). We restricted our analyses of preference to three species: wild boar, roe deer and sika deer because we lacked data on the relative abundance of other prey species. Based on the utilization and availability of each prey species, Jacobs's index (Jacobs 1974) was calculated: D= (ri– pi)/(ri+ pi– 2ripi), where ri is the percent occurrence of prey item i obtained by the scat analysis and pi is the proportional abundance of prey item i obtained by the N-mixture model. The index values range from –1 (strongly avoided) to +1 (strongly preferred). |
|
|
|
Tiger
Apr 5, 2022 9:36:21 GMT -5
Post by brobear on Apr 5, 2022 9:36:21 GMT -5
Overlap in space use bioone.org/journals/wildlife-biology/volume-2019/issue-1/wlb.00508/Prey-selection-of-Amur-tigers-in-relation-to-the-spatiotemporal/10.2981/wlb.00508.full We assessed the potential spatial associations between tigers and prey species using two different approaches. First, following Ramesh et al. (2012), we calculated Pianka's index (O) between tigers and major prey (Pianka 1973) using the presence of each species at each camera station in the spaa package in the R software (Zhang et al. 2013). Next, we used a single-species single-season occupancy model to evaluate the habitat use of tigers while accounting for the imperfect detection (MacKenzie 2006). Given there were multiple camera trap stations within each tiger's home range, it is habitat use, rather than occupancy that we are modeling. We assumed animals move randomly between the fine-scale sampling sites, which relaxed the assumption of geographical closure typically required for occupancy models. We defined two-week periods as temporal replicates and constructed detection histories of tigers and for each camera station over 13 sampling occasions. We considered the relative abundance (number of detections acquired/100 trap days) of three major prey species as predictors of tiger occupancy, the trail type (forest road or game trail at each camera location) and camera days (effort) as predictors of detection. Occupancy model also was implemented in the unmarked package. To assess model goodness-of-fit, we used 1000 parametric bootstrap samples on a χ2-test that is appropriate for binary data. |
|
|
|
Tiger
Apr 5, 2022 9:37:12 GMT -5
Post by brobear on Apr 5, 2022 9:37:12 GMT -5
Activity pattern and temporal overlap bioone.org/journals/wildlife-biology/volume-2019/issue-1/wlb.00508/Prey-selection-of-Amur-tigers-in-relation-to-the-spatiotemporal/10.2981/wlb.00508.full We defined dawn and dusk time periods as 1 h prior to and 1 h post sunrise and sunset, respectively (Farris et al. 2015). Species primarily active during dawn and dusk are referred to as crepuscular. We defined diurnal time period as between dawn and dusk, whereas nocturnal time period was between dusk and dawn. For this, program Moonrise 3.5 (< www.rocketdownload.com/program/moonrise-424593.html>) was used to determine the daily times of sunrise and sunset during the study period. Consequently, the activity times of each independent event per species were classified into three categories: crepuscular (05:01–7:00 and 15:44–17:43 h), diurnal (07:01–15:43 h) and nocturnal (17:44–05:00 h). Then, the activity patterns of each species were classified into the following categories: crepuscular (approximately 50% of detections during the crepuscular phase), diurnal (<10% of detections in the night), nocturnal (>90% of detections in the night), mostly diurnal (10–30% of detections in the night), mostly nocturnal (70–90% of detections in the night) and cathemeral (the rest of the detections) (Jiménez et al. 2010). We used kernel density estimation to quantify the activity density of tigers and their prey types. Then, we used the R package ‘overlap’ to estimate the overlapping of activity patterns between them (Ridout and Linkie 2009). To assess whether tigers and prey differed in their diel activity patterns, we tested the percent photographic capture for each hour using a Spearman's rank correlation coefficient test (Spearman's ρ). |
|
|
|
Tiger
Apr 5, 2022 9:38:06 GMT -5
Post by brobear on Apr 5, 2022 9:38:06 GMT -5
Results bioone.org/journals/wildlife-biology/volume-2019/issue-1/wlb.00508/Prey-selection-of-Amur-tigers-in-relation-to-the-spatiotemporal/10.2981/wlb.00508.full A total of 148 scats were collected in our analyses. Among them, 118 tiger scats and 3 leopard scats were confirmed by DNA. Three tiger scats were removed from further analysis because they contained grass, leaves or unidentifiable dietary remains. The remaining 27 scats were unidentifiable using DNA and discarded from analysis. At least 9 tigers were identified from the scats used, which was confirmed by our previous DNA analysis (Dou et al. 2016). Six prey species were identified in tiger faeces (Table 1). Six scats (5%) contained two prey items. Wild ungulates constituted 93.82% of the total biomass consumed, followed by domestic species (5.15%) and mustelids (1.03%). Wild boar and sika deer were two most dominant prey species in terms of biomass consumed (83%) in tiger scats (Table 1). |
|
|
|
Tiger
Apr 5, 2022 9:40:02 GMT -5
Post by brobear on Apr 5, 2022 9:40:02 GMT -5
Reply #35 - Interesting... Quote: Wild ungulates constituted 93.82% of the total biomass consumed, followed by domestic species (5.15%) and mustelids (1.03%). Wild boar and sika deer were two most dominant prey species in terms of biomass consumed (83%) in tiger scats (Table 1). *Note: no bears. |
|
|
|
Tiger
Apr 5, 2022 9:42:10 GMT -5
Post by brobear on Apr 5, 2022 9:42:10 GMT -5
Prey abundance and selection bioone.org/journals/wildlife-biology/volume-2019/issue-1/wlb.00508/Prey-selection-of-Amur-tigers-in-relation-to-the-spatiotemporal/10.2981/wlb.00508.full From November 2014 to April 2015, a total of 1288 independent photographs of 19 potential prey species were obtained over 17 048trap days (Table 2). We also obtained 131 photos of 11 tigers (5 males and 6 females). Tigers triggered 40% of all camera stations. Based on N-mixture model results, relative abundance (±SE) of wild boar, roe deer and sika deer were 1.90 (±0.50), 3.30 (±0.70) and 2.18 (±0.28), respectively, in the winter of 2014–2015. The three ungulates were photographed at 45, 52 and 43% of the stations, respectively (Table 2, Fig. 2). The detection probability of three ungulates varied among two-week time periods and was strongly influenced by sampling effort (camera days, for wild boar β=0.53, SE=0.25, p=0.03, for roe deer β=0.66, SE=0.23, p<0.01, for sika deer β=0.68, SE=0.22, p<0.01). The percent occurrence of prey species consumed by tigers did not reflect the abundance available; tigers showed a notable preference for wild boar (D=0.58, 95% CI: 0.38–0.64), appeared to use sika deer similarly to their availability (D=–0.02, 95% CI: –0.29 to 0.11) but roe deer was not preferred (D=–0.65, 95% CI: –0.81 to –0.53) (Fig. 3). Table 1. Prey species composition of tiger diets and their percent occurrence with 95% confidence interval, estimated weight (X), correction factor of weight per collected scat (Y) and biomass contribution in Hunchun Nature Reserve, northeast China, between November 2014 and April 2015. Results are based on scat samples (n = 115) confirmed by genetic analysis from Amur tigers.  |
|
|
|
Tiger
Apr 5, 2022 9:44:01 GMT -5
Post by brobear on Apr 5, 2022 9:44:01 GMT -5
Spatiotemporal overlap between the tiger and its main prey species bioone.org/journals/wildlife-biology/volume-2019/issue-1/wlb.00508/Prey-selection-of-Amur-tigers-in-relation-to-the-spatiotemporal/10.2981/wlb.00508.full Tigers spatially overlapped with sika deer (O=0.35) to a greater extent than with wild boar (O=0.16) and roe deer (O=0.18) (Table 3, Fig. 2). Our occupancy model confirmed that tiger habitat use was significantly positively correlated with sika deer spatially but were considerably negatively correlated with roe deer (Table 4). Tigers were estimated to occur across 56% (95% CI: 44–68%) of the camera trap stations. Our chi-square statistic indicated no evidence for lack of model fit (p=0.185). Table 2. List of tiger, leopard and potential prey species recorded by the camera traps, showing the number of trap stations, the number of independent detections and detection rate (number of detections per 100 trap nights) in Hunchun Nature Reserve, northeast China. 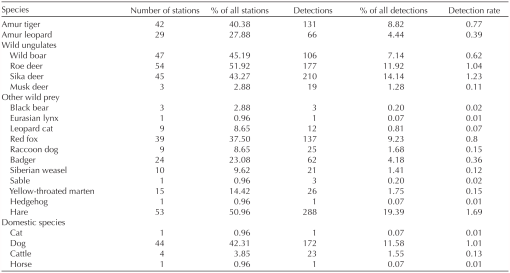 |
|
|
|
Tiger
Apr 5, 2022 9:46:44 GMT -5
Post by brobear on Apr 5, 2022 9:46:44 GMT -5
Tigers showed a strong nocturnal and crepuscular pattern (78.8% of detections between sunset and sunrise) but exhibited peaks of activity around dawn and dusk (Table 5, Fig. 4). Wild boar exhibited similar activity patterns but showed peaks around dusk. The activity patterns of sika deer and roe deer were mostly diurnal, but roe deer exhibited peaks of activity around twilight, tending towards being crepuscular (Table 5, Fig. 4). Temporal activity of tigers was significantly correlated with wild boar temporally (Spearman's ρ = 0.22, p < 0.01) with temporal overlap Δ = 0.76 (95% CI: 0.67–0.85), but were significantly not in sync with sika deer (Spearman's ρ = –0.42, p < 0.01) and the temporal overlap was low (Δ = 0.69, 95% CI: 0.61–0.78) (Table 3, Fig. 4). Activity of tiger and roe deer was not correlated significantly (Spearman's ρ = 0.02, p < 0.01) with temporal overlap Δ = 0.74 (95% CI: 0.65–0.83).  |
|


